
Analyze connected partner data
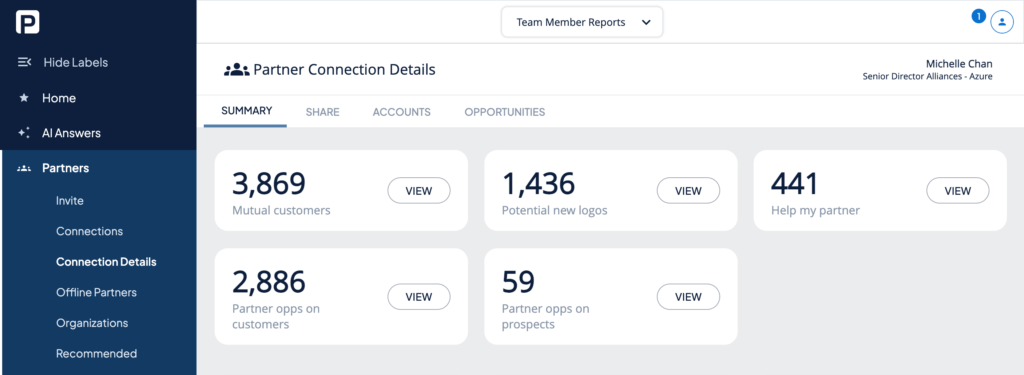
When a connected partner shares data with you, PartnerTap instantly maps your data together and displays the results in the connected partner overlap dashboard. Here you can see a summary of your mutual customers, customer and prospect overlap, and opportunity overlap if you are both sharing opportunities.
You can also see breakdowns by industry, company size, and location. From there, PartnerTap gives you 20 out-of-the-box account reports (opens in a new tab) and 10 out-of-the-box opportunity reports (opens in a new tab) to run on your connected partner mapped data so you can slice and dice the data in whatever way serves you best.
View your overlap dashboard
- Click Partners in the left sidebar.
- Click Connections and find the partner you want to review.
- Click View on their tile.
- You will be directed to the Summary sub-tab on the Partner Connection Details page. This dashboard provides a visualization of mutual customer counts, prospect overlaps, and shared opportunities, with further segmentation by location, industry, and company size.
View your connected partner reports
Account reports
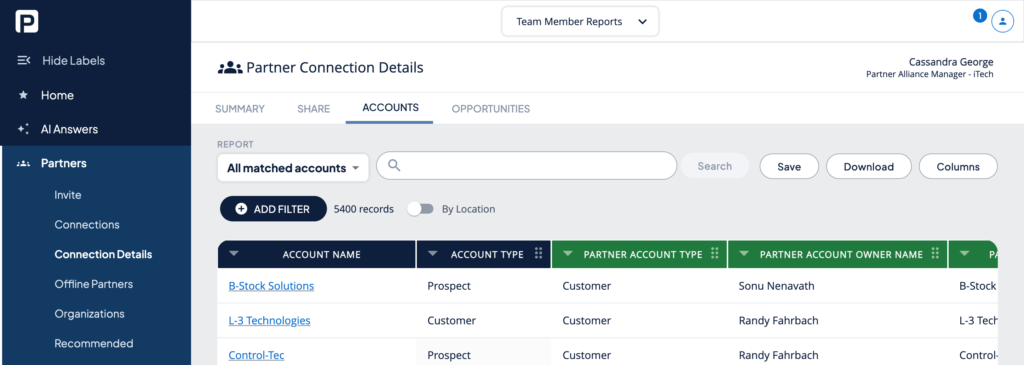
- From the Partner Connection Details page, click the Accounts sub-navigation tab.
- Open the Report dropdown in the top left to switch between the 20 available account reports.
We recommend starting with these five:
| Report | What it shows |
| Mutual customers | Companies where both sides have a customer relationship. Cross-sell and upsell opportunities. |
| Potential new logos | Your prospects that are your partner’s customers. Your partner can help you get a foot in the door. |
| Help my partner | Your customers that are your partner’s prospects. New logo opportunities for your partner. |
| Greenfield accounts | Your partner’s accounts that are not in your CRM at all. |
| My pipeline on matched accounts | Open opportunities your partner can help you accelerate and win. |
Opportunity reports
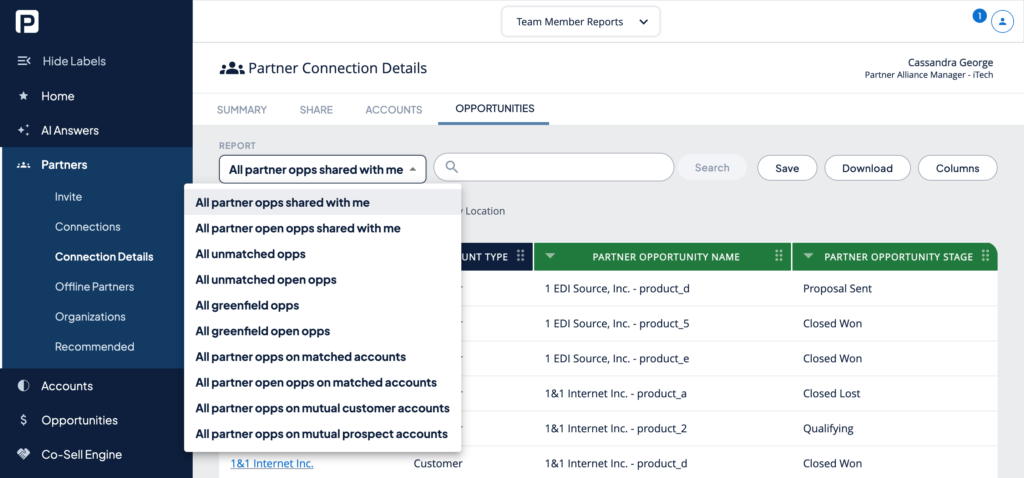
- From the Partner Connection Details page, click the Opportunities sub-navigation tab.
- Open the Report dropdown in the top left to switch between the 10 available opportunity reports.
Work with report data
Within any report, use the toolbar above the data table to adjust your view:
- Report dropdown (top left): Switch between pre-built reports.
- By Location checkbox: Filters results to accounts where address fields also match. Reduces match count but increases geographic precision.
- Add Filter button: Narrow results by any column in your data set. You can stack multiple filters.
- Save button: Opens the Save Report As dialog. Choose Save results as an action list to create a tracked list for co-sell action, or Save report to view later to preserve your current filters and sorting. Saved reports refresh with current data each time you return.
- Download button: Downloads your current report as a CSV for further analysis in Excel.
- Columns button: Show, hide, or reorder columns to get relevant data side by side.
Save your results
When you have filtered down to the accounts you want to act on, click the Save button and select Save results as an action list. Give your list a name and description, then click Save.
For next steps on using your Action List, see Create Action Lists (opens in a new tab).
Want to scale?
See the leading multi-partner co-selling platform.
Invited by a partner?
Sign up for a free PartnerTap account.